News & Notes ~ Dec 2021 + Year-End Comparison

Every year I like to add in a comparison at the end of the year to the year prior being as the December report offers a unique opportunity to look at just that. So, below you’ll find our usual monthly overview & Neighborhood Report along with a comparison; 2021 to 2020.

As always, Lake Oswego info for Dec 2021 is broken out below as well.

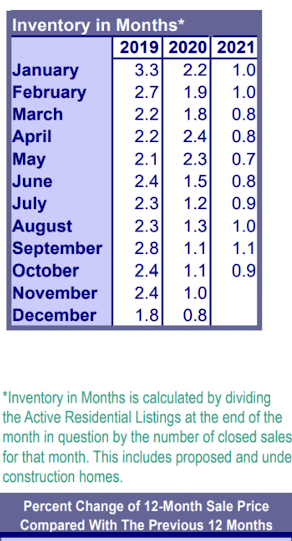
Overview/Fluctuations ~  Market Data Dec 2021 (+2020):    

Inventory is now at a stunning 0.6 months of supply in the Portland area for December. Our supply has simply never been this low… a little more than 2 weeks of Inventory available. Rates as of this writing are hovering around 3.5%, and the Fed is signaling that rates will be rising.                                      

The twelve months of 2021 compared to 2020:

New Listings, (40,531) increased 5.4%.Pending Sales (35,405) increased 7.8%, and –Closed Sales (35,182) increased 9.8%.   ***By Comparison, Twelve months of 2020 (to compare to 2021 above) from last year’s December report read: -New Listings, (38,442) decreased 5.2%, -Pending Sales (32,849) increased 7.9%, and -Closed Sales (32,031) increased 7.8%.

LAKE OSWEGO:

63 Active Listings (Nov 92)
71 New Listings  (Nov 99)
82 Pending Sales (Nov 124)
134 Closed Sales  (Nov 127)
Average Sale Price for Nov: $1,024,400 (Nov $964,300)
NOTE: Higher-Priced vs Lower-Priced Homes Sales can skew the “Average” in any given month.  Lake Oswego has quite a variety, so this tends to be a less meaningful stat, generally speaking, in this niche.
29 Days on the Market   (Nov 36)

The Best of the Holidays To You!

Dianne and I wish you the very best of the season as you hopefully get a chance to slow down a bit and enjoy the people and things you love. We’ll be taking some time off from the Blotter during the holidays and will be back very soon to fill you in on all the latest happenings in the Lake Oswego real estate market!

News & Notes ~ October 2021 Numbers

Here is your look at what’s been happening in the overall Portland area including individual areas of the metro, and with Lake Oswego broken out below:

Overview/Fluctuations ~  Market Data Oct 2021:                                                                                            We’re definitely watching the typical fall/winter slowdown across the board, BUT, in general we’re seeing improvements over the same 10-month period in 2020. Inventory which had started to rise slowly but steadily did take another slight dip in October. Listings increased 6.6% over 2020 during this time period, Pending Sales rose 9.0% and Closed Sales were up by 12.5%.

Rates: “Rates are at around 3.25% right now, however we are seeing continued upward pressure as the Federal Reserve takes steps to combat inflation.”     Gary Boyer, Regional VP, Directors Mortgage                                                                                                                    

According to the RMLS Market Action Report  for the Portland Metro Area, Oct 2021:

  • There were 3,232 New Listings in Oct 2021, down 8.1% from Oct 2020’s 3,515 and also down 14.0% from the previous month/Sept’s 3,760.
  • At 3,129, Oct 2021’s Closed Sales are down 0.8% from Oct 2020’s 3,155, and also down 1.2% from the previous month/Sept’s total of 3,167
  • At 3,187, Oct 2021’s Pending Sales decreased 0.4% from Oct 2020’s 3,199, and increased 0.5% from the previous month/Sept’s total of 3,170.
  • The Average Sale Price in Oct 2021 of $575,200 is up $58,700 from last year/Oct 2020’s $516,500, and up $3,700. from the previous month/Sept’s $571,500.   
  • The “Median” Sale Price (the price smack dab in the middle of all sales) in Oct 2021 of $516,000 rose $56,000 from last year/Oct 2020’s $460,000, and was also up $6,000 from the previous month/Sept’s $510,000.

LAKE OSWEGO:

138 Active Listings (Sep 154)
146 New Listings    (Sep178)
152 Pending Sales (Sep 170)
142 Closed Sales    (Sep 168)
Average Sale Price for Sept: $853,200 (Sep $975,700)
NOTE: Higher-Priced vs Lower-Priced Homes Sales can skew the “Average” in any given month.  Lake Oswego has quite a variety, so this tends to be a less meaningful stat, generally speaking, in this niche.
 27 Days on the Market   (Sep 24)

History of Labor Day

Labor Day pays tribute to the contributions and achievements of American workers and is traditionally observed on the first Monday in September. It was created by the labor movement in the late 19th century and became a federal holiday in 1894 under President Grover Cleveland.

Peter J. McGuire, a carpenter and labor union leader and Matthew Maguire were the two who who came up with the idea for Labor Day. They thought American workers should be honored with their own day. Peter was the vice president of the American Federation of Labor and Matthew was secretary of the Central Labor Union in New York. Some stories say these men with similar last names were actually brothers. In any case, they chose a date midway between the Fourth of July and Thanksgiving. The weather would be ideal for parades and picnics, two events we still enjoy on Labor Day today. They proposed his idea to New York’s Central Labor Union early in 1882, and they thought the holiday was a good idea, too. This holiday was in response to a series of worker strikes in the late 19th century as workers protested against unfair working conditions.

The first Labor Day holiday was celebrated on Tuesday, September 5, 1882, in New York City, in accordance with the plans of the Central Labor Union. The Central Labor Union held its second Labor Day holiday just a year later, on September 5, 1883.

***Data from: earthsky.org, history.com, americaslibrary.com, Wikipedia, NY Times

3D Printed Houses

This is a bit of a divergence from the usual posts that Linda and I write where we try to focus on Lake Oswego Real Estate. Instead I decided to share something that I find just fascinating: 3D printed houses.

A company in Texas, ICON, is 3D printing houses. The company set a goal of finding a way to build houses that are more affordable, resilient, and that can be built faster. Their first house was built in 2018. it was 350 square feet and took 48 hours to print out. It was built in Austin, Texas, a place with very strict building codes. The house was fully permitted.

The printer is quite large, as you can imagine. It’s called a Vulcan II. It extrudes a cement compound called Lavacrete. It pours out 5-7 inches per second. Today, a 400-500 square foot house can be built in 24 hours.

Today, houses can be built up to 2000 square feet.

I say “built”, but I think that is a rather a loose term in this enstance. Once the shell of the house has been “printed”, it is set on a foundation and the components, like windows, doors, plumbing, etc., are added.

The printer can do more than build square boxes. It can be programed for things like curved walls and vaulted ceilings.

The cost savings is approximately half of a traditional stick built home. Partnering with Mobile Loaves and Fishes, ICON is working to build housing for the homeless.

I just love the inovation and found this entire concept intriquing. For more information, click here.

I hope you found this as fascinating as I did, and, as always, thanks for reading the blotter.

Dianne

News & Notes ~ March 2021 Numbers

Here is your wider Portland Market Report according to RMLS data, with overall Neighborhood changes and Lake Oswego data broken out below.

Overview/Fluctuations ~  Market Data March 2021:                                              

Low Inventory continues to be the driver of competition in the greater Portland area where we see price increases in most neighborhoods/areas from the prior month & all areas increasing over 2020. (See below for breakdown). Comparing 2021 to the same period in 2020 thru March, Overall Average Price has increased 16.6% and Median Price 14.9%.

My trusted Mortgage Advisors say Mortgage rates are hovering around 3.125%. This rate varies and can be reduced with a buy-down, or affected by individual qualifiers. I’m happy to connect you with someone to discuss your particular situation.         

According to the RMLS Market Action Report  for the Portland Metro Area, March 2021:

  • There were 3,465 New Listings in March 2021 decreased only slightly at 0.1% from March 2020’s 3,468 and increased 40.1% from the previous month/February’s 2,474.
  • At 2,556, March 2021’s Closed Sales are up 8.5% from March 2020’s 2,356, and also up 29.2% from the previous month/February’s total of 1,978
  • At 3,346, March 2021’s Pending Sales increased 42.6% from March 2020’s 2,347, and also jumped up by 51.5% from the previous month/February’s total of 2,208.
  • The Average Sale Price in March 2021 of $554,300 is up $88,800 from last year/March2020’s $465,500, and up $12,300. from the previous month/February’s $542,000.   
  • The “Median” Sale Price (the price smack dab in the middle of all sales) in March 2021 of $488,000 rose $63,000 from last year/March 2020’s $425,000, and also increased $8,900 from the previous month/February’s $479,100.

LAKE OSWEGO

The combined areas of Lake Oswego and West Linn for the month of March 2021 reported:

  • 112 Active Listings (Feb 82)
  • 188 New Listings    (Feb 97)
  • 156 Pending Sales (Feb 92)
  • 112 Closed Sales    (Feb 92)
  • Average Sale Price for Mar: $944,100  (Feb $876,900)
    • NOTE: Higher-Priced vs Lower-Priced Homes Sales can skew the “Average” in any given month.  Lake Oswego has quite a variety, so this tends to be a less meaningful stat, generally speaking, in this niche.
  •  77 Average Days on the Market   (Feb 77)

Market Activity ~ April 5-11, 2021

NEW April 5-11, 2021

AddressList Price# Beds# BathsTotal SFProp Type
526 S State ST  5A$314,95021914CONDO
225 CERVANTES$319,00021.11216CONDO
3101 MCNARY PKWY  #6$399,90032.11532CONDO
76 GREENRIDGE CT$674,90043.12868ATTACHD
16041 WALUGA DR$679,000421982DETACHD
9 FALSTAFF ST$759,00042.12436DETACHD
18634 Bryant RD$775,00032.12858DETACHD
19233 INDIAN SPRINGS RD$799,95044.13423DETACHD
537 COUNTRY CLUB RD$849,000321901DETACHD
100 LEONARD ST, Upper Lvl$965,00032.12482CONDO
524 WEIDMAN CT$979,00042.13450DETACHD
6 DOVER WAY$1,795,00043.14499DETACHD
17979 S CRESTLINE DR$3,045,000434858DETACHD

PENDING April 5-11, 2021

AddressList Price# Beds# BathsTotal SFProp TypeCDOM
366 CERVANTES CIR$210,00021832CONDO2
4 TOUCHSTONE  #82$258,00032.11351CONDO238
5840 SW BURMA RD$475,00031.11632DETACHD47
19255 BENFIELD AVE$499,000321840DETACHD36
5720 KENNY ST$499,900321416DETACHD3
19242 TERRY AVE$619,900421872DETACHD2
143 DEL PRADO ST$621,500321907DETACHD0
17 ABELARD ST$650,000322122DETACHD2
4688 OAKRIDGE RD$675,000321788DETACHD17
17608 SYDNI CT$675,00042.12466ATTACHD19
5316 LOWER DR$699,00032.12016DETACHD15
1268 HIDE A WAY CT$759,90042.12423DETACHD6
115 FURNACE ST  2N$819,00022.11885CONDO30
5 Mountain View LN$849,00053.13850DETACHD61
672 1ST ST$850,00022.11986CONDO4
12793 SIERRA VISTA DR$899,90043.13650DETACHD3
10 YORICK ST$925,00053.14023DETACHD19
1515 CHERRY LN$925,00053.14699DETACHD4
12624 SW 22ND AVE$945,00043.13665DETACHD4
5544 KILCHURN AVE$995,00042.13308DETACHD4
115 ASH ST$1,025,000434469DETACHD7
18041 CARDINAL DR$1,095,00032.11950DETACHD1
1061 YATES ST$1,100,00043.12899DETACHD14
4431 BERNARD ST$1,149,000432840DETACHD23
486 LAKE BAY CT$1,150,000321603DETACHD4
1255 Bickner ST$1,199,00042.12764DETACHD58
18958 BRYANT RD$1,199,90042.13178DETACHD13
1992 PALISADES TERRACE DR$1,250,00053.14140DETACHD7
13613 PROVINCIAL HILL WAY$1,550,00063.14534DETACHD4
15400 DIAMOND HEAD RD$2,100,00043.13358DETACHD1
95 IRON MOUNTAIN BLVD$2,195,00054.15710DETACHD184
15780 TWIN FIR RD$2,769,90044.14270DETACHD44

SOLD April 5-11, 2021`

AddressOpening PriceClosed Price# Beds# BathsTotal SFProp TypeCDOM
47 EAGLE CREST DR  #43$209,500$212,000211017CONDO3
4000 CARMAN DR   G101$248,900$260,00022869CONDO4
4644 LOWER DR, Upper Lvl$260,000$285,00021.11170CONDO5
578 2ND ST$539,900$539,90022.11361PLNCOMM6
853 E AVE$650,000$650,00021750DETACHD6
2679 GLEN EAGLES RD$729,900$702,000332378DETACHD277
18975 OLSON AVE$600,000$736,000633569DETACHD5
33 TOUCHSTONE$699,900$770,000543854DETACHD5
4749 BLACK FOREST CT$715,000$775,00042.12255DETACHD5
5796 BAY POINT DR$775,000$843,00042.12399DETACHD2
16631 FORD PL$899,900$920,00042.13180DETACHD4
4184 VIRGINIA WAY$849,900$976,000421700DETACHD5
2240 RIDGEWOOD RD$939,000$1,075,00043.12777DETACHD2
100 GARIBALDI ST$1,175,000$1,210,00053.24572DETACHD3
15420 BOONES WAY$1,345,000$1,325,00032.13364ATTACHD43
419 7TH ST$1,350,000$1,350,00042.12813DETACHD11
17010 Canal CIR$1,595,000$1,665,00043.13746DETACHD
1947 Summit DR$1,795,000$1,716,00045.15570DETACHD150
16655 MAPLE CIR$3,498,000$3,170,00033.13100DETACHD0

Criteria: Homes in the 97034 and 97035 zip code, listed, pending or sold between the dates listed above as reported by the Regional Multiple Listing Service (RMLS). DETACHD refers to Single Family Detached Residence, MFG refers to manufactured housing, and ATTACHD refers to single-family residences with some portion of the structure attached to another property, but not constituting CONDO ownership. DOM stands for days on market, or the number of days from when the listing became active and when it received an acceptable offer, with CDOM standing for “cumulative days on market” accounting for “refreshed” listings.