Every year I like to add in a comparison at the end of the year to the year prior being as the December report offers a unique opportunity to look at just that. So, below you’ll find our usual monthly overview & Neighborhood Report along with a comparison; 2021 to 2020.
As always, Lake Oswego info for Dec 2021 is broken out below as well.
Overview/Fluctuations ~ Market Data Dec 2021 (+2020):

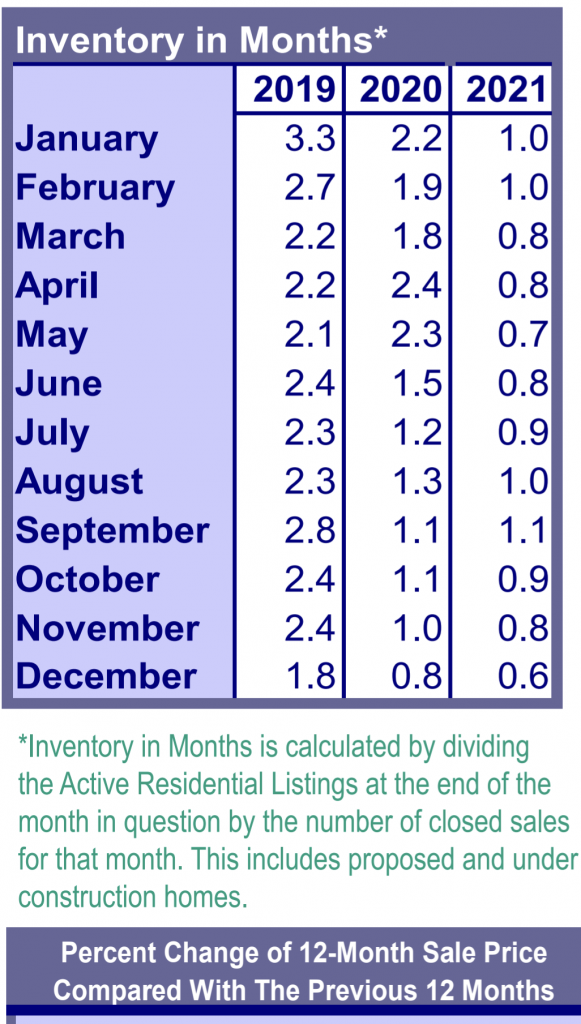
Inventory is now at a stunning 0.6 months of supply in the Portland area for December. Our supply has simply never been this low… a little more than 2 weeks of Inventory available. Rates as of this writing are hovering around 3.5%, and the Fed is signaling that rates will be rising.
The twelve months of 2021 compared to 2020:
–New Listings, (40,531) increased 5.4%. –Pending Sales (35,405) increased 7.8%, and –Closed Sales (35,182) increased 9.8%. ***By Comparison, Twelve months of 2020 (to compare to 2021 above) from last year’s December report read: -New Listings, (38,442) decreased 5.2%, -Pending Sales (32,849) increased 7.9%, and -Closed Sales (32,031) increased 7.8%.

LAKE OSWEGO:
63 Active Listings (Nov 92)
71 New Listings (Nov 99)
82 Pending Sales (Nov 124)
134 Closed Sales (Nov 127)
Average Sale Price for Nov: $1,024,400 (Nov $964,300)
NOTE: Higher-Priced vs Lower-Priced Homes Sales can skew the “Average” in any given month. Lake Oswego has quite a variety, so this tends to be a less meaningful stat, generally speaking, in this niche.
29 Days on the Market (Nov 36)
