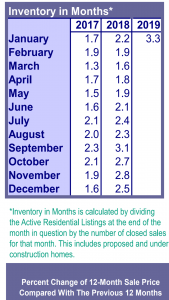
 Here is your look at the most recent data for the entire Portland area (Jan 2019) and how Lake Oswego fits in to this picture just below.
According to the RMLS Market Action Report for the Portland Metro Area, January, 2019:
- There were 3,048 New Listings in January 2019 which was up 22.0% from January of 2018’s 2,486, and more than double the previous month/Dec of 2018’s total of 1,255 .
- At 1,451 January 2019’s Closed Sales cooled 10.9% from January 2018’s 2,311, and also 21.4 % from the previous month/Dec 2018’s total of 1,846.
- January 2019’s Pending Sales (accepted offers), at 2,045 are down 11.5% down from January of 2018’s 2,311, and surged ahead 27.9% from the previous month/Dec 2018’s total of 1,599.
- The Average Sale Price in January 2019 of $435,600 was down slightly/$800.00 from last year/January 2018’s $436,400, and also down a little from the previous month/Dec 2018’s $438,600 by $3,000.
- The Median Sale Price in January 2019 of $384,900 was down $5,100.00 from last year/January 2018’s $390,000, and also down the same from the previous month/Dec 2018’s $390,000.
Neighborhoods: January’s Average Sale Price + 12-month Appreciation :
- North Portland: $403,900 2.8% (Dec 388,700)
- YTD Median: $379,500
- NE Portland: $439,500 3.5% (Dec 450,600)
- YTD Median: $370,000
- SE Portland: $390,000 5.5% (Dec 425,900)
- YTD Median: $357,000
- Gresham/Troutdale: $349,300 6.5% (Dec 338,500)
- YTD Median: $346,300
- Milwaukie/Clackamas: $410,500 3.6% (Dec 427,500)
- YTD Median: $389,900
- Oregon City/Canby: $397,100 6.4% (Dec 428,600 )
- YTD Median: $366,500
- Lake Oswego/West Linn:$664,200 2.3% (Dec 636,300)
- YTD Median: $532,500
- West Portland: $589,800 3.1% (Dec 588,800)
- YTD Median: $525,000
- NW Wash County: $559,600 1.8% (Dec 483,400)
- YTD Median: $572,500
- Beaverton/Aloha: $393,900 8.8% (Dec 381,600 )
- YTD Median: $365,000
- Tigard/Wilsonville: $440,100 6.3% (Dec 459,600 )
- YTD Median: $410,000
- Hillsboro/Forest Grove: $391,500 5.5% (Dec 382,100 )
- YTD Median: $372,500
LAKE OSWEGO:
The combined areas of Lake Oswego and West Linn for the month of January 2019 reported:
-
- 299 Active Listings (Dec 296 )
- 185 New Listings (Dec 115)
- 94 Pending Sales (Dec 91)
- 82 Closed Sales (Dec 75)
- Average Sale Price for January: $664,200 (Dec $636,300)
- NOTE: Higher-Priced vs Lower-Priced Homes Sales can skew the “Average” in any given month. Lake Oswego has quite a variety, so this tends to be a less meaningful stat, generally speaking, in this niche.
- 76 Average Days on the Market (Dec 76)
