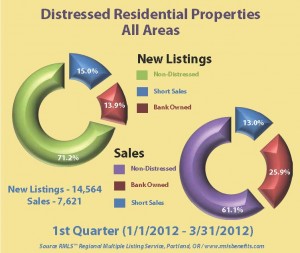
 The RMLS recently provided this graph to Realtors and I found it interesting. It occurred to me that you might as well.
It clearly shows that while distressed sales make up 17.2% percent of the new listings, they make up nearly 29% of the closed sales. Of that the shortsales are pretty consistent being 15% of the new listings and 13% of the closed sales. Whereas the foreclosures are just 13.2% of the new listing but account for 25.6% of the closed sales.
I do think that the banks are throwing houses out onto the market at pretty rock bottom prices. I’ve seen a few houses lately, priced so low, that half a dozen offers get written within days. Then the bank takes a week to respond and even more offers get written. This is a very negative thing for surrounding property values. What I am describing here is happening in much greater numbers outside of Lake Oswego, but I’ve seen some of it here as well.
The other interesting characteristic on this graph is the non-distressed properties. They represent 71.2 % of the new listings, but 61.1% of the closed sales. That 10% difference? I think that’s over-priced housing that has not adjusted to the reality of the current market.
I’ll work to find a happier subject for my next editiorial post, but I did find these graphs both useful and interesting.
Dianne
