
Here is your look at the most recent data for the entire Portland area (Nov2020) and how Lake Oswego fits in to this picture just below.
Overview/Fluctuations ~ Market Data Nov 2020:
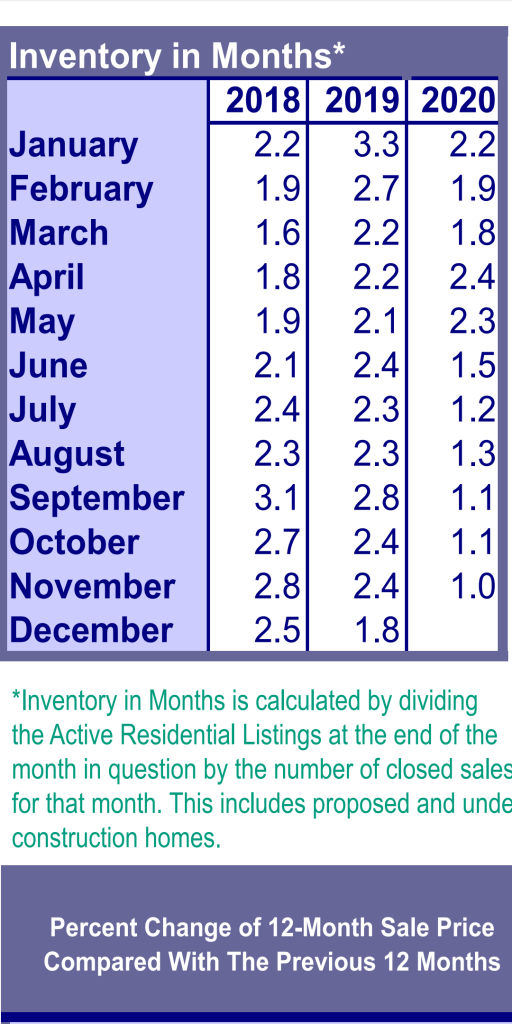
Inventory is now at 1.0 months of supply here, locally. The lowest it’s ever been. All forecasts are for continued increases in home sales and prices, though more modestly than 2020. Prediction #’s vary among economists. National Association of Realtors (NAR) is predicting a 7.3% increase in sales nationally in 2021. Interest rates are still hovering around 2.875% but are expected to rise, albeit not dramatically. One very interesting item I noted from the NAR information is that nationally, 1 in 6 home purchases is now “multi-generational”. So, how we live is changing in many ways: People are looking for more space to work from home, and generations are moving in together. There is generally more up-sizing than down-sizing going on.
According to the RMLS Market Action Report for the Portland Metro Area, Nov. 2020:
- There were 2,238 New Listings in Nov 2020 increased 5.7% from Nov of 2019’s 2,118, and decreased a whopping 36.3% from the previous month/Oct’s 3,515.
- At 2,745, Nov 2020’s Closed Sales are up 12.4% from Nov 2019’s 2,191, and decreased 13.0% from the previous month/Oct 2020’s total of 3,155
- At 2,557, Nov 2020’s Pending Sales are up 12.4% from Nov 2019’s 2,274, and dropped 20.1% from the previous month/Oct 2020’s total of 3,199.
- The Average Sale Price in Nov 2020 of $521,200 is up $58,600 from last year/Nov 2019’s $462,600, and is up $4,700 from the previous month/Oct 2020’s $516,500. YTD increase is 7.1%.
- The “Median” Sale Price (the price smack dab in the middle of all sales) in Nov 2020 of $457,000 rose from last year/Nov2019’s $415,000 by $42,000, and decreased $3,000 from the previous month/Oct 2020’s $460,000. YTD increase is 6.8%.
Neighborhoods: November’s Average Sale Price + 12-month Appreciation:
- North Portland: $480,600 6.2% (Oct $450,300) YTD Median: $431,000
- NE Portland: $508,700 5.0% (Oct $531,200) YTD Median: $455,000
- SE Portland: $478,200 8.1% (Oct $477,300) YTD Median: $409,000
- Gresham/Troutdale: $425,200 5.2% (Oct $412,900) YTD Median: $378,000
- Milwaukie/Clackamas: $510,700 7.7% (Oct $512,100) YTD Median: $450,000
- Oregon City/Canby: $506,300 6.5% (Oct $511,300) YTD Median: $440,500
- Lake Oswego/W Linn:$822,000 10.9% (Oct $756,600) YTD Median: $645,000
- West Portland: $650,400 5.1% (Oct $685,900) YTD Median: $550,000
- NW Wash County: $578,900 6.2% (Oct $595,600) YTD Median: $527,500
- Beaverton/Aloha: $449,100 5.2% (Oct $451,200) YTD Median: $417,000
- Tigard/Wilsonville: $528,200 9.5% (Oct $516,700) YTD Median: $479,000
- Hillsboro/Forest Grove: $444,400 5.6% (Oct $445,600)YTD Median: $410,000
LAKE OSWEGO:
- The combined areas of Lake Oswego and West Linn for the month of November 2020 reported:
- 177 Active Listings (Oct 213)
- 104 New Listings (Oct 197)
- 106 Pending Sales (Oct 193)
- 166 Closed Sales (Oct 173)
- Average Sale Price for Nov: $822,000 (Oct $756,600)
- NOTE: Higher-Priced vs Lower-Priced Homes Sales can skew the “Average” in any given month. Lake Oswego has quite a variety, so this tends to be a less meaningful stat, generally speaking, in this niche.
- 50 Average Days on the Market (Oct 59)